

Electric scooter spec sheets are not lies. They are measurements taken under conditions you will never ride in: a light rider, a warm battery, smooth tarmac, no wind and the gentlest ride mode. Your commute has none of those, which is why real-world range, top speed and charge time so often fall short of manufacturer claims.
That gap is predictable and measurable. A claimed 40-mile range that delivers 31 to 35 miles for a 90 kg (198 lb) rider in mixed city use is not a defective scooter. It is the difference between a lab number and a road number, and knowing the size of that gap before you buy is the whole point of testing.
This guide gives you a repeatable protocol. The speed, acceleration, hill and braking tests fit into one afternoon, while the range and charging tests need one full charge cycle. It covers what to declare before you ride, six core metrics (GPS top speed, acceleration, hill climbing, an electric scooter range test, braking distance and charge time), the arithmetic that checks a spec sheet before you leave the house, and how to publish results other riders can reproduce.
The short answer: to check electric scooter spec accuracy, write down your test conditions, measure top speed as a GPS two-way average, ride a range loop down to 15 to 20 percent charge, measure three braking stops from 20 mph, and put each result next to the claim. Real-world range will almost always land below the headline figure. Your weight, speed, temperature and terrain decide by how much.
Table of contents
- Electric Scooter Spec Check at a Glance
- Why Spec Accuracy Matters
- Before You Test Anything
- What Brands Usually Publish (and What’s Missing)
- How to Set Up a Fair, Repeatable Scooter Test
- Six Core Metrics to Verify (Step-by-Step)
- Sustained Top Speed (GPS, two-way average)
- Acceleration (0 to 15 mph and 15 to 25 mph, two runs each)
- Hill Performance (time or minimum speed on known grade)
- Range (loop until about 15 to 20% SoC, then extrapolate a conservative window)
- Braking Distance (three 20→0 mph stops)
- Charge Time (15→100% with wall timer, note taper)
- Bonus Metric: Real Battery Capacity and Watt-Hours per Mile
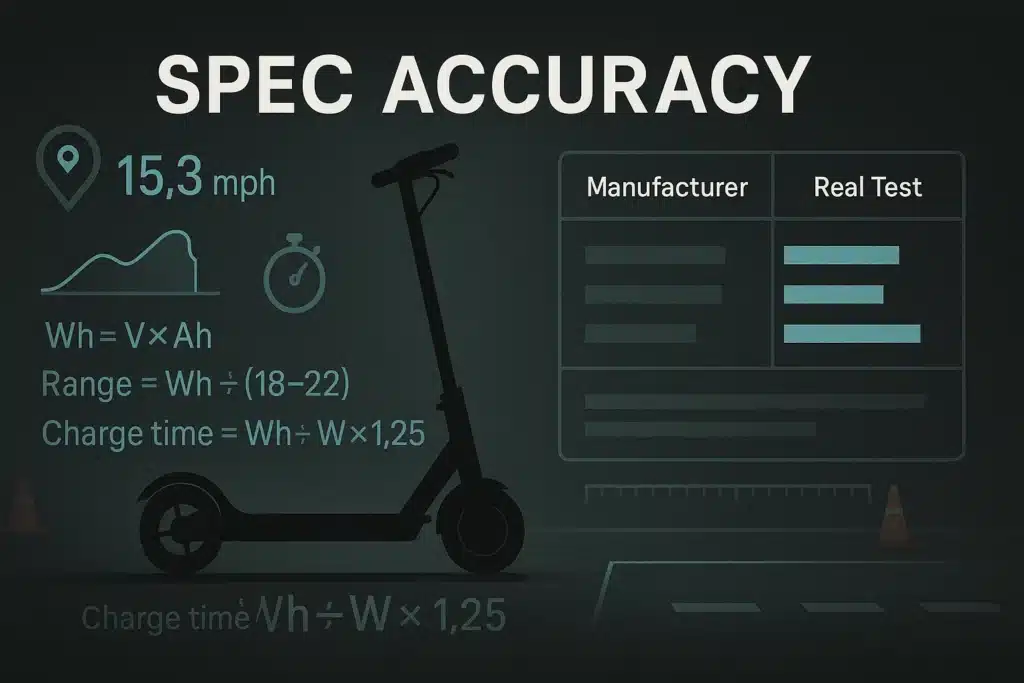
- Quick Math That De-Risks Claims
- Three Spec Sheet Claims You Can Check With a Calculator
- Why Real Tests Differ from the Spec Sheet
- Publish Results the Right Way (So Others Can Reproduce)
- Selling Scooters? How to Publish a Spec Sheet Riders Will Trust
- Common Pitfalls and Better Alternatives
- 20-Minute Field Protocol (Printable)
- What Riders Ask About Range Claims, GPS Speed, Hills and Braking
- Glossary
- Checklist
Electric Scooter Spec Check at a Glance
Each claim on a scooter spec sheet can be checked with one test and one line of arithmetic. The sections below explain every row in detail.
| Spec claim | How to test it | Quick math | What to expect |
|---|---|---|---|
| Range | Loop from 100% to 15 to 20% charge, logging GPS miles | Wh ÷ 20 to 30 = realistic miles | Independent tests average roughly 60 to 70% of the claim |
| Top speed | Two-way GPS average on flat ground | GPS speed ÷ dashboard speed = display correction | A dashboard that disagrees with GPS needs a correction factor |
| Braking | Three stops from 20 mph; report the middle one | mph² ÷ (30 × feet) = deceleration in g | Published e-scooter hard stops: about 0.23 to 0.5 g |
| Charge time | Wall timer from 15% to 100% | Wh ÷ charger W × 1.15 to 1.30 | Usually longer than the brochure, because charging slows near full |
| Motor power | Find the controller’s battery current limit | V × battery amps = max electrical input | Peak ratings above that figure never reach the wheel |
| Battery capacity | Plug-in energy meter on the recharge | Wall Wh × 0.85 ÷ share of battery used | Well below the claim means an aged pack or an inflated spec |
Why Spec Accuracy Matters
Numbers guide decisions. Your commute, budget, and safety all depend on trustworthy specs. If top speed is off by just 3 to 4 mph, you may miss light timings or choose unsafe roads. If the claimed range is optimistic by 30% or more, which independent tests show is common, you might arrive home with a depleted pack. That creates stress and shortens battery life.
Small testing choices produce large swings. A light test rider, tailwind, high tire pressure, and a warm battery will boost range and speed. Conversely, cold weather, low tire pressure, rough asphalt, and a heavier rider cut performance. Therefore, you should compare like with like. Use a clear framework that records conditions and repeats them. Then you’ll know whether differences come from marketing, methods, or your route.
Accuracy also builds trust. When you publish transparent results, other riders can reproduce your numbers. That helps the community choose scooters based on reality, not hype.
Before You Test Anything
This protocol involves maximum-speed runs, hard braking from 20 mph, and full-throttle hill climbs. Three things to settle first.
Where you test is a legal question, not just a practical one. Rules vary widely. In the UK, privately owned e-scooters cannot legally be ridden on public roads, pavements or cycle lanes at all; only rental scooters in official trial areas are allowed, and UK government guidance caps those at 15.5 mph, with the trials currently due to end in May 2028. In the US, many states and cities cap e-scooters at around 20 mph, with local variation. A full-throttle run on a public road may exceed the legal limit even if your scooter is capable of it. Private land with the owner’s permission, such as a closed private road, an unused private car park or a private track, is the realistic option, and in the UK it is the only legal one for a privately owned scooter. Check your local rules before you plan a route.
Protective gear is not optional for this. Helmet always. For braking tests specifically, add gloves and consider knee and elbow protection, because a rear wheel lift at 20 mph puts you on the ground at speed. Bed-in and full-power stops are exactly where riders come off.
Clear the route and use a spotter. Braking tests need a straight, clean, level run with no cross traffic and nobody behind you. Acceleration runs need clear sight lines. A second person marking distances and watching for traffic makes the whole protocol faster and considerably safer.
One certification note worth knowing if you are testing a scooter you are considering buying rather than one you own. The US Consumer Product Safety Commission has called on manufacturers, retailers and importers to comply with UL 2272 for personal e-mobility electrical systems and UL 2271 for battery packs, and in June 2026 CPSC published a proposed mandatory safety standard for lithium-ion batteries in micromobility products, citing 227 fire, explosion and overheating incidents from 2019 through 2023, linked to 39 deaths and 181 injuries. The rule is not final yet, so UL certification remains the check that matters today. New York City has required third-party certification since September 2023. A scooter without UL certification is a fire risk question separate from anything in its spec sheet, and it is worth checking before you spend an afternoon measuring its top speed. The broader principle applies to any product claim: a specification is worth what its evidence is worth, and the difference between verifiable proof and asserted proof is covered in this look at what hard-to-fake evidence actually looks like.
What Brands Usually Publish (and What’s Missing)

Commonly published fields
- Top speed: a single best figure.
- Range: often measured in eco mode at slow speed.
- Motor power: nominal watts; sometimes a “peak” claim.
- Battery energy: volts (V) and amp-hours (Ah) or watt-hours (Wh).
- Charge time: round numbers (e.g., 6 to 8 hours).
- Brakes: type only (mechanical disc, drum, regen).
- Tires: size and type (pneumatic, solid, tubeless).
- Weight: scooter only, sometimes without accessories.
Often omitted, but essential for context
- Rider + gear weight used for tests.
- Temperature and wind at time of test.
- Road grade for hill claims.
- Controller limits: battery current (A) and phase current (A).
- Test method: GPS vs app, one-way vs two-way average.
- Repeatability: number of runs and variance.
- Tire pressure at start (cold PSI).
- State of charge (SoC) at test start and end.
These missing pieces matter. Without them, you cannot explain why your results differ. Fill the gaps with your own declarations so others can reproduce your ride.
How to Set Up a Fair, Repeatable Scooter Test
Consistency beats perfection. Declare your conditions, pick a simple route, and log the results the same way every time.
Declare before you ride
- Rider + gear weight: include helmet, jacket, tools (e.g., 198 lb / 90 kg).
- Temperature and wind: note °F (°C) and wind direction/speed.
- Surface: smooth asphalt, rough chip seal, or mixed.
- Tire pressure (cold): front/rear PSI, measured before riding.
- Ride mode: eco/normal/sport and any speed limit setting.
- Battery start SoC: percent at roll-off; note battery health if known.
- Measurement tools: GPS app or standalone device; same for all runs.
Route components
- Flat speed section: out-and-back for two-way average.
- Hill segment: 7 to 10% grade over 0.15 to 0.25 miles (250 to 400 m).
- Rough asphalt patch: to test stability and efficiency.
- Safe braking area: straight, clean, level, 250+ feet (75+ m).
Log it in a small table
Use the same table each time. Keep it simple and scannable.
Test Declaration
| Rider+Gear | Temp / Wind | Surface | Tire PSI (F/R) | Mode | Battery Start | Tools |
|---|---|---|---|---|---|---|
| 198 lb (90 kg) | 72°F (22°C), 4 mph headwind N | Smooth asphalt | 45 / 45 | Sport | 100% SoC | GPS logger + wall timer |
(Replace values with your own.)
Six Core Metrics to Verify (Step-by-Step)
You’ll measure speed, acceleration, hills, range, braking, and charging. Repeat key runs two or three times, then average. Use safe, open spaces and protective gear.
Sustained Top Speed (GPS, two-way average)
Goal: Verify the steady, sustainable top speed on level ground.
Steps
- Warm tires for 5 minutes at moderate pace.
- Mark a flat, straight course with safe sight lines.
- Make a full-throttle run in direction A for 0.2 to 0.3 miles.
- Turn around and repeat in direction B immediately.
- Record both GPS speeds; average them to cancel wind/grade.
- Note road texture, wind, and SoC at start and end.
Tips
- Keep stance and tuck consistent.
- If speed creeps up late, extend the run until stable.
- Use the same body position every time to control aero drag.
Acceleration (0 to 15 mph and 15 to 25 mph, two runs each)
Goal: Check launch vigor and mid-speed punch.
Steps
- From a dead stop, record 0 to 15 mph twice; average results.
- Then roll at 12 to 13 mph, punch to 25 mph twice, and time the 15 to 25 mph portion; average.
- Log SoC drop after each run to note power sag.
Tips
- Start with hands and feet in the same position.
- Do not “preload” throttle early.
- If wheel spin occurs, shift slightly rearward and retry.
Hill Performance (time or minimum speed on known grade)
Goal: Quantify climbing capability on a consistent slope.
Steps
- Pick a hill with a consistent slope and measure the grade rather than estimate it. Three ways, in descending order of accuracy: a cycling route planner or topographic map showing elevation profile, a GPS app that reports grade live, or the arithmetic, which is rise divided by run × 100. A hill climbing 30 feet over 400 feet of distance is a 7.5% grade. Estimating by eye is unreliable, which is why hill results are the hardest to compare between riders.
- Start at 5 mph, then apply full throttle at the base.
- Record time to distance (e.g., 0.2 miles) or minimum speed observed.
- Repeat twice; average. Note rider line and any weaving.
Tips
- Controller battery amps correlate strongly with hill results.
- Heat builds fast; allow 2 to 3 minutes of cooldown between runs.
Range (loop until about 15 to 20% SoC, then extrapolate a conservative window)
Goal: Establish a usable, real-world range window.
Steps
- Create a 1 to 2 mile loop with varied surfaces and stops.
- Ride at a typical commute pace in a single mode.
- Log GPS miles at each 10% SoC drop.
- Stop at 15 to 20% SoC to preserve battery health.
- Extrapolate to 0% for a theoretical max, but publish a safe window based on comfort with reserves.
Tips
- Keep tire PSI constant and consistent.
- If conditions change mid-test, note them next to the mileage log.
Braking Distance (three 20→0 mph stops)
Goal: Measure real stopping distance, not just brake type.
Steps
- Bed pads first: 8 to 10 moderate stops from about 15 mph to warm rotors/drums.
- Mark a starting line and measure 20→0 mph on level, clean pavement.
- Perform three controlled full-power stops.
- Record distances. Use the middle number for reporting; keep the min/max for variance.
Tips
- Keep weight centered and low; avoid rear wheel lift.
- Repeat after pad adjustments or new tires for consistency.
Charge Time (15→100% with wall timer, note taper)
Goal: Confirm how long a complete charge takes in practice.
Steps
- Ride down to roughly 15% SoC rather than 5%. Deep discharges shorten pack life, and you can extrapolate the missing portion accurately from the charge curve. Let the scooter cool for 30 to 60 minutes before plugging in, and never charge a pack that has been in freezing conditions until it has warmed up indoors.
- Start a wall timer when you plug in.
- Note time to 90% and time to 100% separately.
- Record charger label (V/A) and outlet voltage if available.
- Repeat once to confirm consistency.
A note on charging to 100%. Doing it for a test is fine. Doing it habitually is not. Lithium packs last longest when cycled between roughly 20% and 80%, and holding at full charge accelerates degradation. Charge to 100% before a long ride, and leave it at 80% the rest of the time. Your range test numbers will still be comparable as long as you use the same window each time.
Tips
- Most packs taper charging over the last 10 to 15%.
- Parallel chargers need good ventilation and manufacturer approval.
Bonus Metric: Real Battery Capacity and Watt-Hours per Mile
Every range claim rests on one number you can check directly: the battery’s watt-hours. Brands calculate it from nominal voltage and amp-hours, which tells you what the cells are rated for, not what your pack delivers after a year of commuting. A plug-in energy meter, the kind that sits between the wall socket and the charger, lets you measure real battery capacity for about the price of a pizza.
- Run the range test above, starting at 100% and stopping at 15 to 20% state of charge. Note the miles ridden (from GPS, not the dashboard) and the exact end percentage.
- Let the pack cool, or warm up indoors if it has been cold, then plug the charger into the energy meter and reset it.
- Charge to 100% and wait until the charger light turns green, so the slow taper phase is included. Unplug at that point, because many chargers keep drawing a little power afterwards.
- Read the watt-hours on the meter and multiply by 0.85. Chargers and cells lose roughly 10 to 20 percent of wall energy as heat, and 0.85 is a sensible middle value if you have no better figure for your charger.
- Divide that number by the miles you rode. The result is your watt-hours per mile, the single most useful efficiency figure a scooter owner can have.
A worked example. You ride 27 miles from 100% down to 20%, and the recharge draws 690 Wh at the wall. 690 × 0.85 = 587 Wh into the pack, so you used about 21.7 Wh per mile. That ride used roughly 80% of the battery, so the full pack holds around 587 ÷ 0.8 = 734 Wh, close to a claimed 720 Wh. The spec holds up.
If the same calculation came back near 520 Wh for a pack sold as 720 Wh, you would have a real finding: an aged pack, lower-grade cells or an inflated claim. Treat it as a flag rather than a verdict, because the percentage on many scooter displays is estimated from voltage and is not perfectly linear. Repeat the test once before drawing conclusions, and rerun it every six months to track battery health.
Quick Math That De-Risks Claims
You can sanity-check many claims with simple math. These estimates keep expectations realistic.
- Wh = V × Ah
Example: 48 V × 15 Ah = 720 Wh. - Charger W = V × A
Example: 54.6 V × 2 A = 109.2 W (typical 48 V “2A” charger). - Ideal charge time (h) ≈ Wh ÷ Charger W
Example: 720 Wh ÷ 109 W ≈ 6.6 h. - Real charge time (h) = Ideal × 1.15 to 1.30 (taper + losses)
Example: 6.6 h × 1.25 ≈ 8.3 h. - Urban range window (mi) ≈ Wh ÷ (20 to 30)
Example: 720 Wh ÷ 25 ≈ 29 miles, with a window of 24 to 36 miles. Use 20 for light riders in an eco mode on flat routes, 25 for typical mixed commuting, and 30 for heavier riders, top speed modes, hills or cold weather. - Why battery amps matter
Controller battery current (A) often predicts launches and hill holds better than “peak watts.” Peak power is brief and marketing-friendly. Battery amps reflect sustained demand the pack and controller allow. Combine this with system voltage for a practical power picture.
Use these checks before you buy. They also explain why your real charge time is longer than the glossy brochure suggests.
Three Spec Sheet Claims You Can Check With a Calculator
The formulas above cover range and charging. Three more claims come apart just as quickly once you run the numbers.
Peak Power: Check It Against the Controller
The biggest number on most listings is peak power, and it is also the least useful. The most electrical power a scooter can draw is roughly its nominal battery voltage multiplied by the controller’s battery current limit.
- Max electrical input (W) ≈ V × controller battery amps
Example: 48 V × 25 A = 1,200 W.
If that scooter is sold as “2,000 W peak,” the extra 800 W is a motor rating the controller never lets you reach. Output at the wheel is lower still, because the motor and controller turn part of that power into heat and pack voltage sags under load. Compare continuous power with continuous power and peak with peak, never one against the other. A maximum rating and a rated operating figure are different claims about the same product, the same trap buyers fall into when they compare a flexible LED panel’s maximum bend with a corner cabinet’s rated 90-degree angle.
Controller current rarely appears on a spec sheet. Check the label on the controller itself or the manufacturer’s support pages, or ask the seller in writing. A brand that will not tell you is telling you something.
Braking Distance: Convert It to Deceleration
A stopping distance from 20 mph cannot be compared directly with one from 15 mph, because distance grows with the square of speed. Convert it to deceleration and every braking result becomes comparable:
- Deceleration (g) ≈ mph² ÷ (30 × stopping distance in feet)
Example: 20 mph stopped in 34 ft = 400 ÷ 1,020 ≈ 0.39 g. - Metric: deceleration (m/s²) = (km/h ÷ 3.6)² ÷ (2 × stopping distance in metres)
For a reference point, a 2025 track study from France’s Gustave Eiffel University measured hard stops on a popular commuter e-scooter at an average of about 3.7 m/s², roughly 0.38 g, against close to 6 m/s² for e-bikes. That works out to about 35 feet from 20 mph. The authors compared their results with earlier research, where e-scooter averages span roughly 2.2 to 4.9 m/s² (about 0.23 to 0.5 g) depending on rider, model and method, so treat any single figure as a reference rather than a pass mark. If your stops come in below about 0.23 g, which means more than roughly 58 feet from 20 mph, your brakes are doing less than the weakest published average. Re-bed the pads, clean the rotors or drums, check cable tension and tire pressure, then retest.
Speedometer Accuracy: Calibrate the Dashboard
Scooter dashboards calculate speed from wheel rotation and a programmed wheel size, so tire wear, tire pressure and the configured wheel size all shift the reading. Your GPS two-way average from the top speed test gives you a correction factor:
- Dashboard correction = GPS speed ÷ dashboard speed
Example: the dashboard shows 25.4 mph and the GPS average is 23.6 mph. 23.6 ÷ 25.4 = 0.93, so the dashboard reads about 7% high.
Multiply any dashboard reading by that factor. The same error applies to the odometer, which matters for range: a dashboard that reads 7% fast also counts miles 7% generously, so log range tests from GPS distance. It also explains the most common top speed gap. If a brand’s 25 mph claim matches what the dashboard shows rather than what GPS measures, the scooter is not slow. The display is optimistic, and so is any spec built from it.
Why Real Tests Differ from the Spec Sheet
Real roads add variables that spec sheets ignore. Most of them push your numbers in the same direction: down.
- Voltage sag: Under load, pack voltage dips, reducing power.
- Thermal limits: Controllers and motors derate when hot.
- Tire type/pressure: Low PSI, soft compounds and solid tires increase rolling resistance, and solid tires also lengthen braking distance on rough surfaces.
- Surface roughness: Chip seal and potholes slow you more than smooth asphalt.
- Wind and aero: A mild headwind can erase several mph.
- Rider mass and stance: More mass and an upright pose cost speed and range.
- Measurement tools: App-reported speed may overstate; GPS two-way averages are more reliable.
- Battery state: Cold packs deliver less; warm (but not hot) packs perform better.
How much temperature actually costs you
“Cold packs deliver less” is true and not usable. Here is what it means in practice.
Lithium-ion packs lose usable capacity as they cool below their comfort zone. Near freezing, a range loss of roughly 20 to 30 percent is common, and the loss keeps growing as it gets colder. A scooter that does 35 miles in July may manage 25 in January, with nothing wrong with it.
What this means for testing. A range test in December and a range test in June are not comparable results, and treating them as such will make you think your battery is degrading when it is only cold. Either test in the same season each time, or record temperature and state it alongside every range figure.
Two things follow, and one is a safety point.
Optimal operating and charging temperature for these cells is roughly 10°C to 25°C (50°F to 77°F). Outside that window, performance and longevity both suffer.
Never charge a lithium pack that is below freezing. Charging a cold cell causes permanent lithium plating on the anode, reduces capacity, and can create internal shorts. If your scooter has been outside in cold weather, bring it indoors and let it warm for one to four hours before plugging it in. This matters for the charge-time test in this protocol: a charge test run on a cold pack is both inaccurate and damaging.
Publish Results the Right Way (So Others Can Reproduce)
Clarity helps the community compare apples to apples. Publish a short declaration table, a simple “claims vs tests” table, and one-line takeaways per metric.
Best practices
- Keep formatting consistent across models and seasons.
- Include variance: show ranges or min/median/max where useful.
- Flag anomalies and retests due to wind spikes or traffic.
Claim vs Real Test
| Metric | Manufacturer | Your Result | Gap | Note |
|---|---|---|---|---|
| Top Speed (mph) | 25 | 23.6 (GPS, two-way avg) | -1.4 | Mild headwind; 198 lb rider |
| 0 to 15 mph (s) | Not stated | 3.9 (avg of 2) | n/a | Sport mode |
| Hill (7% min mph) | “Good climbing” | 12.8 mph | n/a | 0.2 mi segment |
| Range (mi) | 40 | 31 to 35 usable | -5 to -9 | Ridden 100% to 15% SoC, extrapolated |
| 20→0 mph (ft) | Not stated | 36 / 38 / 41 | n/a | Middle value reported (about 0.35 g) |
| Charge (full) | 6 to 8 h | 8.3 h (7.0 h measured from 15%) | +0.3 to +2.3 h | 2A charger; missing 15% extrapolated |
Illustrative example, not a test of a specific model. Replace every value with your own results and keep notes brief.
One-line takeaway examples
- “GPS top speed is 23.6 mph; feels stable at max.”
- “Range is 31 to 35 miles for a 198 lb rider in mixed city use.”
- “Braking distance 38 ft from 20 mph after pad bedding (about 0.35 g); consistent lever feel.”
Once you have a few models tested to the same protocol, comparison becomes the useful output. Independent review sites are worth reading alongside your own numbers, mainly to see whether their published conditions match yours. A review that reports a range figure without stating rider weight, temperature and mode is telling you about their test, not about the scooter.
Selling Scooters? How to Publish a Spec Sheet Riders Will Trust
Everything in this protocol is written for riders, but it doubles as a brief for brands and retailers. Any number a rider can test is a number a rider can publicly contradict, and one detailed review saying “range is half the claim” costs more trust than an honest, smaller figure ever would.
Five changes make an electric scooter spec sheet credible:
- State the conditions beside every range and speed figure. Rider weight, ride mode, average speed, temperature and surface, in the same format as the Test Declaration table above. A range claim with no conditions cannot be checked, which is exactly why experienced riders discount it.
- Publish range as a window with two scenarios. For example, eco mode with a light rider on flat roads, and the top mode with a heavier rider in mixed city riding. Buyers can place themselves between the two.
- List watt-hours, nominal voltage and controller battery current. Label motor power as continuous or peak. Amp-hours alone make a 15 Ah pack at 36 V and a 15 Ah pack at 48 V look identical, when the 48 V pack stores a third more energy.
- Show certification on the product page, as text. Name the UL 2272 listing for the electrical system, the UL 2271 listing for the battery, and the lab that certified them. With the CPSC proposal covered earlier in this guide, US buyers have more reason than ever to look for it.
- Write specs as text, not images. A range figure inside a banner graphic is invisible to screen readers, search engines and AI shopping assistants alike.
Presentation matters as much as honesty. Premium product sites solve the tension between casual browsers and detail-hungry buyers with layered spec disclosure: headline numbers up top, the full test declaration one tap away, nothing buried in a PDF. The same principle runs through product pages that answer the buying question, where tested proof and honestly stated limits outperform superlatives, and plain-text specs stay readable to the assistants that increasingly summarize a product before a human ever sees it.
Common Pitfalls and Better Alternatives
- Peak power fixation → Prefer continuous power plus controller battery amps.
- Eco-mode range → Publish a range window with surface, PSI, and rider weight stated.
- App speed only → Use GPS two-way averages for speed validation.
- Charge time claims → Include a taper factor (×1.15 to 1.30) in estimates.
- Brake type equals safety → Measure 20→0 mph distance after proper pad bedding.
- One run only → Take two or three runs; report average and spread.
- No declaration → Always share conditions so others can reproduce.
20-Minute Field Protocol (Printable)
This fast workflow gives credible numbers when time is short. It skips the range and charging tests, which need a full charge cycle.
- Warm-up (3 min): Easy pace to stabilize tire temperature and PSI.
- Test declaration (1 min): Record rider+gear, temp/wind, PSI, mode, SoC.
- Top speed (4 min): Two GPS runs (A/B) on flat; note average.
- Acceleration (3 min): Two 0 to 15 mph and two 15 to 25 mph pulls; average each pair.
- Hill check (3 min): One grade run; record minimum speed or time.
- Braking (4 min): One bedding lap, then three 20→0 mph stops; note middle distance.
- Photo-log (2 min): Snapshot speed screens, SoC, and timer for documentation.
You now have a baseline you can trust. Repeat monthly or after maintenance to track changes.
What Riders Ask About Range Claims, GPS Speed, Hills and Braking
Usually, but not always. Voltage sets the ceiling, and controller current limits, motor winding and wheel size decide whether you reach it. A 60 V scooter with a conservative controller can be slower than a well-configured 48 V one.
Less accurate than the box suggests. Independent testers who ride scooters until they shut down in mixed city conditions typically see real-world range land somewhere between about half and nine tenths of the claim, with averages of roughly 60 to 70 percent. The gap is largest for heavy riders, fast modes, hills and cold weather, and smallest for modest claims measured in realistic conditions.
Roughly 15 to 20 Wh per mile for gentle riding in an eco mode on flat ground, and around 25 to 35 Wh per mile for full-speed commuting with stops and hills. Heavier riders, cold packs and headwinds push it higher. Measure your own with a plug-in energy meter using the bonus metric above; your number beats any published average.
Yes for top speed, if you use two-way averages on a flat route with a clear view of the sky. It is weaker for short acceleration runs, because most phones log position about once per second; a dedicated GPS logger with a faster update rate does better there. Avoid tall buildings and heavy tree cover.
Controller battery amps plus system voltage predict sustained hill speed better than short peak bursts. Multiply the two for the most power the pack can actually deliver on a long climb.
Convert your result to deceleration so it is comparable: mph² ÷ (30 × feet). Published tests put hard e-scooter stops at roughly 0.23 to 0.5 g, and one 2025 track study averaged 0.38 g, about 35 feet from 20 mph. If yours needs more than about 58 feet, re-bed the pads, clean the rotors or drums, check cable tension and tire pressure, then retest.
Charge to 100%, ride a 1 to 2 mile loop at your normal pace in one ride mode, log GPS miles at every 10% drop, and stop at 15 to 20% charge. Extrapolate to 0% for a theoretical maximum, then publish a smaller usable window. Write down your weight, the temperature, tire pressure and ride mode, or the result cannot be compared with anyone else’s.
Glossary
- Continuous power: The power a motor can deliver steadily without overheating.
- Peak power: A short burst of maximum power; not sustained.
- Controller current (battery amps): The current drawn from the battery under load.
- Watt-hour (Wh): Battery energy capacity; volts × amp-hours.
- Watt-hours per mile (Wh/mi): Energy used per mile ridden; the most useful efficiency figure for comparing scooters and riding styles.
- Amp-hour (Ah): Battery “size” describing charge capacity.
- State of charge (SoC): Battery percentage remaining.
- Voltage sag: Temporary voltage drop when you hit the throttle.
- Taper: The slowing of charging near the end to protect the battery.
- Range window: A realistic mileage span based on conditions and rider mass.
- GPS-verified speed: Speed measured by GPS, averaged both directions.
- Deceleration (g): Braking force expressed as a fraction of gravity; it makes stops from different speeds comparable.
- Gross rolling mass: Combined weight of rider, gear, and scooter.
- Grade: Road slope, usually expressed as a percent.
- Bed-in (brakes): Process of conditioning pads and rotors/drums for consistent friction.
- Two-way average: Out-and-back measurement to cancel wind and slight grade.
- Thermal derating: Automatic power reduction when components get hot.
Checklist
Setup
- Record rider+gear, temp/wind, surface, tire PSI (cold), mode, SoC.
- Inspect brakes and tires; bed pads if new.
- Choose flat loop, hill segment, and safe braking area.
Tests
- Top speed: two GPS runs (A/B), average.
- Acceleration: two 0 to 15 mph and two 15 to 25 mph runs.
- Hill: minimum speed or time on a known grade.
- Range: ride loops to 15 to 20% SoC; log GPS miles by 10% steps.
- Braking: three 20→0 mph stops; report the middle value.
- Charging: 15→100% with wall timer.
- Battery capacity (optional): energy meter reading × 0.85, divided by miles ridden, for Wh per mile.
Logging and math
- Fill Test Declaration table and Claim vs Real table.
- Compute Wh, charger W, ideal and real charge times.
- Estimate urban range window using Wh ÷ 20 to 30.
- Convert braking distance to deceleration: mph² ÷ (30 × feet).
- Correct dashboard speed with your GPS factor.
Publishing
- Share conditions and methods.
- Report averages and note variance.
- Add one-line takeaways per metric.
Last reviewed in September 2026. This update corrected the UK legal position and added the June 2026 CPSC proposal, braking deceleration benchmarks, a battery capacity test and a range formula aligned with independent test data. The test steps and formulas draw on published micromobility research, battery safety guidance and independent range-testing practice. The example tables are illustrative, not results from a specific scooter.