
Getting scooter spec accuracy right is harder than it looks. Manufacturer numbers are measured under ideal conditions, while real rides happen in wind, traffic, and heat. This guide shows you how to validate the numbers with fair, repeatable tests you can run in a single afternoon. You’ll learn simple routes, logging tables, and math checks that reveal what your scooter can actually do. For broader model context, see our site’s Electric Scooters Reviews. In this article, we’ll explore all about spec accuracy and explain the difference between real tests vs manufacturer claims.
Why Spec Accuracy Matters
Numbers guide decisions. Your commute, budget, and safety all depend on trustworthy specs. If top speed is off by just 3–4 mph, you may miss light timings or choose unsafe roads. If the claimed range is optimistic by 20–30%, you might arrive home with a depleted pack. That creates stress and shortens battery life.
Small testing choices produce large swings. A light test rider, tailwind, high tire pressure, and a warm battery will boost range and speed. Conversely, cold weather, low tire pressure, rough asphalt, and a heavier rider cut performance. Therefore, you should compare like with like. Use a clear framework that records conditions and repeats them. Then you’ll know whether differences come from marketing, methods, or your route.
Finally, accuracy builds trust. When you publish transparent results, other riders can reproduce your numbers. That helps the community choose scooters based on reality, not hype.
What Brands Usually Publish (and What’s Missing)
Commonly published fields Spec Accuracy: Real Tests vs Manufacturer Claims
- Top speed: a single best figure.
- Range: often measured in eco mode at slow speed.
- Motor power: nominal watts; sometimes a “peak” claim.
- Battery energy: volts (V) and amp-hours (Ah) or watt-hours (Wh).
- Charge time: round numbers (e.g., 6–8 hours).
- Brakes: type only (mechanical disc, drum, regen).
- Tires: size and type (pneumatic, solid, tubeless).
- Weight: scooter only, sometimes without accessories.
Often omitted—but essential for context
- Rider + gear weight used for tests.
- Temperature and wind at time of test.
- Road grade for hill claims.
- Controller limits: battery current (A) and phase current (A).
- Test method: GPS vs app, one-way vs two-way average.
- Repeatability: number of runs and variance.
- Tire pressure at start (cold PSI).
- State of charge (SoC) at test start and end.
These missing pieces matter. Without them, you cannot explain why your results differ. Fill the gaps with your own declarations so others can reproduce your ride.
A Fair & Repeatable Test Framework for Scooter Spec Accuracy
Consistency beats perfection. Declare your conditions, pick a simple route, and log the results the same way every time.
Declare before you ride Spec Accuracy: Real Tests vs Manufacturer Claims
- Rider + gear weight: include helmet, jacket, tools (e.g., 198 lb / 90 kg).
- Temperature & wind: note °F (°C) and wind direction/speed.
- Surface: smooth asphalt, rough chip seal, or mixed.
- Tire pressure (cold): front/rear PSI, measured before riding.
- Ride mode: eco/normal/sport and any speed limit setting.
- Battery start SoC: percent at roll-off; note battery health if known.
- Measurement tools: GPS app or standalone device; same for all runs.
Route components
- Flat speed section: out-and-back for two-way average.
- Hill segment: 7–10% grade over 0.15–0.25 miles (250–400 m).
- Rough asphalt patch: to test stability and efficiency.
- Safe braking area: straight, clean, level, 250+ feet (75+ m).
Log it in a small table
Use the same table each time. Keep it simple and scannable.
Table 1: Test Declaration Spec Accuracy
| Rider+Gear | Temp / Wind | Surface | Tire PSI (F/R) | Mode | Battery Start | Tools |
|---|---|---|---|---|---|---|
| 198 lb (90 kg) | 72°F (22°C), 4 mph headwind N | Smooth asphalt | 45 / 45 | Sport | 100% SoC | GPS logger + wall timer |
(Replace values with your own.)
Six Core Metrics to Verify (Step-by-Step)
You’ll measure speed, acceleration, hills, range, braking, and charging. Repeat key runs twice or three times, then average. Use safe, open spaces and protective gear.
Sustained Top Speed (GPS, two-way average) Spec Accuracy: Real Tests vs Manufacturer Claims
Goal: Verify the steady, sustainable top speed on level ground.
Steps Spec Accuracy: Real Tests vs Manufacturer Claims
- Warm tires for 5 minutes at moderate pace.
- Mark a flat, straight course with safe sight lines.
- Make a full-throttle run in direction A for 0.2–0.3 miles.
- Turn around and repeat in direction B immediately.
- Record both GPS speeds; average them to cancel wind/grade.
- Note road texture, wind, and SoC at start and end.
Tips
- Keep stance and tuck consistent.
- If speed creeps up late, extend the run until stable.
- Use the same body position every time to control aero drag.
Acceleration (0–15 mph, 15–25 mph; two runs each)
Goal: Check launch vigor and mid-speed punch.
Steps
- From a dead stop, record 0–15 mph twice; average results.
- Then roll at 12–13 mph, punch to 25 mph twice; average.
- Log SoC drop after each run to note power sag.
Tips
- Start with hands and feet in the same position.
- Do not “preload” throttle early.
- If wheel spin occurs, shift slightly rearward and retry.
Hill Performance (time or minimum speed on known grade) – Spec Accuracy: Real Tests vs Manufacturer Claims
Goal: Quantify climbing capability on a consistent slope.
Steps
- Pick a 7–10% grade hill with uniform surface.
- Start at 5 mph, then apply full throttle at the base.
- Record time to distance (e.g., 0.2 miles) or minimum speed observed.
- Repeat twice; average. Note rider line and any weaving.
Tips
- Controller battery amps correlate strongly with hill results.
- Heat builds fast; allow 2–3 minutes of cooldown between runs.
Range (loop until ~15–20% SoC; extrapolate a conservative window)
Goal: Establish a usable, real-world range window.
Steps
- Create a 1–2 mile loop with varied surfaces and stops.
- Ride at a typical commute pace in a single mode.
- Log miles at each 10% SoC drop.
- Stop at 15–20% SoC to preserve battery health.
- Extrapolate to 0% for a theoretical max, but publish a safe window based on comfort with reserves.
Tips
- Keep tire PSI constant and consistent.
- If conditions change mid-test, note them next to the mileage log.
Braking Distance (three 20→0 mph stops; average middle result) Spec Accuracy: Real Tests vs Manufacturer Claims
Goal: Measure real stopping distance, not just brake type.
Steps
- Bed pads first: 8–10 moderate stops from ~15 mph to warm rotors/drums.
- Mark a starting line and measure 20→0 mph on level, clean pavement.
- Perform three controlled full-power stops.
- Record distances. Use the middle number for reporting; keep the min/max for variance.
Tips
- Keep weight centered and low; avoid rear wheel lift.
- Repeat after pad adjustments or new tires for consistency.
Charge Time (5→100% with wall timer; note taper)
Goal: Confirm how long a complete charge takes in practice.
Steps
- Ride to ~5% SoC. Let the scooter cool 30–60 minutes.
- Start a wall timer when you plug in.
- Note time to 90% and time to 100% separately.
- Record charger label (V/A) and outlet voltage if available.
- Repeat once to confirm consistency.
Tips
- Most packs taper charging over the last 10–15%.
- Parallel chargers need good ventilation and manufacturer approval.
Quick Math That De-Risks Claims
You can sanity-check many claims with simple math. These estimates keep expectations realistic.
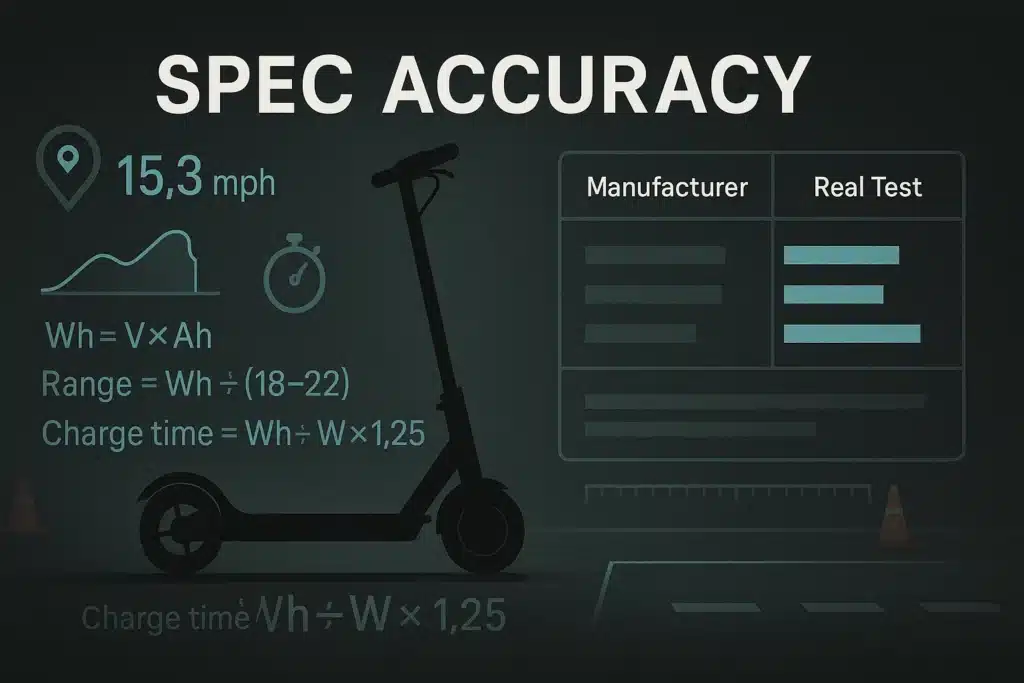
- Wh = V × Ah
Example: 48 V × 15 Ah = 720 Wh. - Charger W = V × A
Example: 54.6 V × 2 A = 109.2 W (typical 48 V “2A” charger). - Ideal charge time (h) ≈ Wh ÷ Charger W
Example: 720 Wh ÷ 109 W ≈ 6.6 h. - Real charge time (h) = Ideal × 1.15–1.30 (taper + losses)
Example: 6.6 h × 1.25 ≈ 8.3 h. - Urban range window (mi) ≈ Wh ÷ (18–22)
Example: 720 Wh ÷ 20 ≈ 36 miles.
Use the 18 divisor for conservative riders, 22 for efficient riders and gentle conditions. - Why battery amps matter
Controller battery current (A) often predicts launches and hill holds better than “peak watts.” Peak power is brief and marketing-friendly. Battery amps reflect sustained demand the pack and controller allow. Combine this with system voltage for a practical power picture.
Use these checks before you buy. They also explain why your real charge time is longer than the glossy brochure suggests.
Why Real Tests Differ from the Spec Sheet
Real roads add variables that spec sheets ignore.
- Voltage sag: Under load, pack voltage dips, reducing power.
- Thermal limits: Controllers and motors derate when hot.
- Tire type/pressure: Low PSI and soft compounds increase rolling resistance.
- Surface roughness: Chip seal and potholes slow you more than smooth asphalt.
- Wind and aero: A mild headwind can erase several mph.
- Rider mass and stance: More mass and an upright pose cost speed and range.
- Measurement tools: App-reported speed may overstate; GPS two-way averages are more reliable.
- Battery state: Cold packs deliver less; warm—but not hot—packs perform better.
Document these factors. Then your scooter spec accuracy story will make sense to others.
Publish Results the Right Way (So Others Can Reproduce)
Clarity helps the community compare apples to apples. Publish a short declaration table, a simple “claims vs tests” table, and one-line takeaways per metric.
Best practices
- Keep formatting consistent across models and seasons.
- Include variance: show ranges or min/median/max where useful.
- Flag anomalies and retests due to wind spikes or traffic.
Table 2: Claim vs Real Test
| Metric | Manufacturer | Your Result | Gap | Note |
|---|---|---|---|---|
| Top Speed (mph) | 25 | 23.6 (GPS, two-way avg) | −1.4 | Mild headwind; 198 lb rider |
| 0–15 mph (s) | — | 3.9 (avg of 2) | — | Sport mode |
| Hill (7% min mph) | “Good climbing” | 12.8 mph | — | 0.2 mi segment |
| Range (mi) | 40 | 31–35 usable | −5 to −9 | 20–80% SoC window |
| 20→0 mph (ft) | — | 52 / 56 / 59 | — | Middle value reported |
| Charge (5→100%) | 6–8 h | 8.3 h | +0.3–2.3 | 2A charger, taper noted |
(Use your actual numbers. Keep notes brief.)
One-line takeaways examples
- “GPS top speed is 23.6 mph; feels stable at max.”
- “Range is 31–35 miles for a 198 lb rider in mixed city use.”
- “Braking distance 56 ft after pad bedding; consistent lever feel.”
Common Pitfalls—and Better Alternatives
- Peak power fixation → Prefer continuous power plus controller battery amps.
- Eco-mode range → Publish a range window with surface, PSI, and rider weight stated.
- App speed only → Use GPS two-way averages for speed validation.
- Charge time claims → Include a taper factor (×1.15–1.30) in estimates.
- Brake type equals safety → Measure 20→0 mph distance after proper pad bedding.
- One run only → Take two or three runs; report average and spread.
- No declaration → Always share conditions so others can reproduce.
20-Minute Field Protocol (Printable)
This fast workflow gives credible numbers when time is short.
- Warm-up (3 min): Easy pace to stabilize tire temperature and PSI.
- Test declaration (1 min): Record rider+gear, temp/wind, PSI, mode, SoC.
- Top speed (4 min): Two GPS runs (A/B) on flat; note average.
- Acceleration (3 min): Two 0–15 mph and two 15–25 mph pulls; average each pair.
- Hill check (3 min): One grade run; record minimum speed or time.
- Braking (4 min): One bedding lap, then three 20→0 mph stops; note middle distance.
- Photo-log (2 min): Snapshot speed screens, SoC, and timer for documentation.
You now have a baseline you can trust. Repeat monthly or after maintenance to track changes.
FAQs
Does higher voltage always mean higher top speed?
Usually, but not always. Voltage sets the ceiling, yet controller limits and gearing matter too.
Why is my real range far below the claim?
Range depends on speed, stops, wind, rider mass, surface, and PSI. Manufacturer tests are often gentler.
How do I improve braking distance safely?
Bed pads properly, clean rotors or drums, check cable tension, and maintain tire pressure.
Is phone GPS accurate enough for testing?
Yes, if you use two-way averages on a flat route and avoid poor signal areas.
What matters more for hills: peak watts or controller amps?
Controller battery amps plus system voltage predict sustained hill speed better than short “peak” bursts.
How do I check charger claims?
Multiply charger V × A for watts, compute Wh ÷ W, then add 15–30% for taper and losses.
How many runs do I need for spec accuracy?
For scooter spec accuracy, take at least two runs per metric and publish averages with short notes.
Do solid tires change results?
Yes. They usually increase rolling resistance and lengthen braking distance on rough surfaces.
Glossary (Plain English)
- Continuous power: The power a motor can deliver steadily without overheating.
- Peak power: A short burst of maximum power; not sustained.
- Controller current (battery amps): The current drawn from the battery under load.
- Watt-hour (Wh): Battery energy capacity; volts × amp-hours.
- Amp-hour (Ah): Battery “size” describing charge capacity.
- State of charge (SoC): Battery percentage remaining.
- Voltage sag: Temporary voltage drop when you hit the throttle.
- Taper: The slowing of charging near the end to protect the battery.
- Range window: A realistic mileage span based on conditions and rider mass.
- GPS-verified speed: Speed measured by GPS, averaged both directions.
- Gross rolling mass: Combined weight of rider, gear, and scooter.
- Grade: Road slope, usually expressed as a percent.
- Bed-in (brakes): Process of conditioning pads and rotors/drums for consistent friction.
- Two-way average: Out-and-back measurement to cancel wind and slight grade.
- Thermal derating: Automatic power reduction when components get hot.
Checklist (Copy/Paste)
Setup
- Record rider+gear, temp/wind, surface, tire PSI (cold), mode, SoC.
- Inspect brakes and tires; bed pads if new.
- Choose flat loop, hill segment, and safe braking area.
Tests
- Top speed: two GPS runs (A/B), average.
- Acceleration: two 0–15 mph and two 15–25 mph runs.
- Hill: minimum speed or time on a known grade.
- Range: ride loops to 15–20% SoC; log miles by 10% steps.
- Braking: three 20→0 mph stops; report the middle value.
- Charging: 5→100% with wall timer; note taper.
Logging & Math
- Fill Test Declaration table and Claim vs Real table.
- Compute Wh, charger W, ideal and real charge times.
- Estimate urban range window using Wh ÷ (18–22).
Publishing
- Share conditions and methods.
- Report averages and note variance.
- Add one-line takeaways per metric.


